
CompTIA Data+ (DA0-001) DA0-001 — Question 22
Topic 1 · Question 22 of 294
Topic 1 · Question 22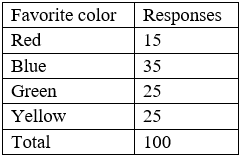
An analyst needs to provide a chart to identify the composition between the categories of the survey response data set: Which of the following charts would be BEST to use?